Load/Fill/Populate Chart with BackgroundWorker in Vb.Net

Please find the code below to load CHART with backgroundworker:

' Create a delegate
Private Delegate Sub chartGenInvDelegate(ByVal chrt As Chart, ByVal invAmt() As Decimal)

Private Sub ChartGenInv(ByVal chrt As Chart, ByVal invAmt() As Decimal)
   Try
       If chrt.InvokeRequired Then
          chrt.Invoke(New chartGenInvDelegate(AddressOf ChartGenInv), chrt, invAmt)
       Else
          
          Dim yValues As Double() = {invAmt(2), invAmt(3), invAmt(4)}
          Dim xValues As String() = {"Current Month", "Last Month", "2 Months Old"}
          Dim seriesName As String = Nothing

          chrt = chrtInvStats
          chrt.Series.Clear()
          chrt.Titles.Clear()

          seriesName = "InvoiceAmount"
          chrt.Series.Add(seriesName)
          chrt.Series(seriesName).Points.DataBindXY(xValues, yValues)

          ' Chart Area Modification
          Dim CArea As ChartArea = chrt.ChartAreas(0)
          CArea.BackColor = Color.Azure
          CArea.ShadowColor = Color.Red
          CArea.Area3DStyle.Enable3D = True

          CArea.AxisX.MajorGrid.Enabled = False
          CArea.AxisY.MajorGrid.Enabled = False

          chrt.Series(seriesName).Points(0).Color = Color.MediumSeaGreen
          chrt.Series(seriesName).Points(1).Color = Color.PaleGreen
          chrt.Series(seriesName).Points(2).Color = Color.LawnGreen

          chrt.Series(seriesName).ChartType = SeriesChartType.Column
          chrt.ChartAreas("ChartArea1").Area3DStyle.Enable3D = True

          ' Formatting the Chart Title
          Dim T As Title = chrt.Titles.Add("Last 3 Months Invoices Total($)")
          With T
               .ForeColor = Color.Black
               .BackColor = Color.LightBlue
               .Font = New System.Drawing.Font("Times New Roman", 11.0F, System.Drawing.FontStyle.Bold)
               .BorderColor = Color.Black
          End With

          chrt.Series(seriesName).IsValueShownAsLabel = True
          chrt.Legends(0).Enabled = False
       End If
   Catch ex As Exception
       MsgBox(ex.Message)
   End Try

End Sub


Private Sub bgwSuburbs_DoWork(ByVal sender As System.Object, ByVal e As System.ComponentModel.DoWorkEventArgs) Handles bgwSuburbs.DoWork
   Try
      ' Get your data in Array
      
      ' Pass chart and Array as a parameter to the invoking function
      ChartGenInv(chrtInvStats, invValues)
   Catch ex As Exception
      MsgBox("No response from server. Please try again."& Chr(10) & ex.Message, MsgBoxStyle.Exclamation, "Data Load Failure")
   End Try
End Sub


Private Sub bgwSuburbs_RunWorkerCompleted(ByVal sender As System.Object, ByVal e As System.ComponentModel.RunWorkerCompletedEventArgs) Handles bgwSuburbs.RunWorkerCompleted
    progressBarLoad.Visible = False
End Sub
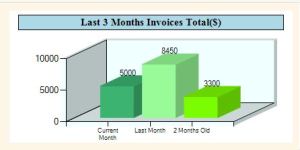
Add/Create/Generate basic Column Chart using Chart Control VB.NET – Visual Studio 2010

Dim yValues As Double() = {invAmt(2), invAmt(3), invAmt(4)} ' ' Getting values from Array
Dim xValues As String() = {"Current Month", "Last Month", "2 Months Old"} ' Headings
Dim seriesName As String = Nothing

' Note 1 : Clear chart before fill - VERY IMPORTANT and can generate exception if you are generating
'          multiple charts in loop and have not included below lines !
' Note 2 : Chrt variable here is the Name of your Chart 
chrt.Series.Clear()
chrt.Titles.Clear()

' Give unique Series Name
seriesName = "ChartInv"
chrt.Series.Add(seriesName)

' Bind X and Y values
chrt.Series(seriesName).Points.DataBindXY(xValues, yValues)

' Chart Area Modification (Optional)
Dim CArea As ChartArea = chrt.ChartAreas(0)
CArea.BackColor = Color.Azure
CArea.ShadowColor = Color.Red
CArea.Area3DStyle.Enable3D = True

' If you don't want to show Gridlines on both X and Y axis, then False or True
CArea.AxisX.MajorGrid.Enabled = False
CArea.AxisY.MajorGrid.Enabled = False

' Define Custom Chart Colors
chrt.Series(seriesName).Points(0).Color = Color.MediumSeaGreen
chrt.Series(seriesName).Points(1).Color = Color.PaleGreen
chrt.Series(seriesName).Points(2).Color = Color.LawnGreen

' Define Chart Type
chrt.Series(seriesName).ChartType = SeriesChartType.Column

' Formatting the Chart Title
Dim T As Title = chrt.Titles.Add("Last 3 Months Invoices Total($)")
With T
       .ForeColor = Color.Black
       .BackColor = Color.LightBlue
       .Font = New System.Drawing.Font("Times New Roman", 11.0F, System.Drawing.FontStyle.Bold)
       .BorderColor = Color.Black
End With

' If you want to show Chart Legends then True or False
chrt.Legends(0).Enabled = False

' If you want to show data values on top of each column then True or False
chrt.Series(seriesName).IsValueShownAsLabel = True

—> See generated Column Chart Below::

Column Chart

Column Chart

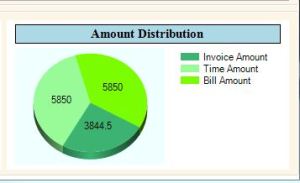
Add/Create/Generate basic Pie Chart using Chart Control VB.NET – Visual Studio 2010

Dim yValues As Double() = {txtInvAmt.Text, txtTimeAmt.Text, txtBillAmt.Text} ' Getting values from Textboxes 
Dim xValues As String() = {"Invoice Amount", "Time Amount", "Bill Amount"} ' Headings
Dim seriesName As String = Nothing

' Note 1 : Clear chart before fill - VERY IMPORTANT and can generate exception if you are generating
'          multiple charts in loop and have not included below lines !
' Note 2 : Chrt variable here is the Name of your Chart 
chrt.Series.Clear()
chrt.Titles.Clear()

' Give unique Series Name
seriesName = "ChartInv"
chrt.Series.Add(seriesName)

' Bind X and Y values
chrt.Series(seriesName).Points.DataBindXY(xValues, yValues)

' Chart Area Modification (Optional)
Dim CArea As ChartArea = chrt.ChartAreas(0)
CArea.BackColor = Color.Azure
CArea.ShadowColor = Color.Red
CArea.Area3DStyle.Enable3D = True

' Define Custom Chart Colors
chrt.Series(seriesName).Points(0).Color = Color.MediumSeaGreen
chrt.Series(seriesName).Points(1).Color = Color.PaleGreen
chrt.Series(seriesName).Points(2).Color = Color.LawnGreen

' Define Chart Type
chrt.Series(seriesName).ChartType = SeriesChartType.Pie

chrt.ChartAreas("ChartArea1").Area3DStyle.Enable3D = True

' Formatting the Chart Title
Dim T As Title = chrt.Titles.Add("Amount Distribution")
With T
       .ForeColor = Color.Black
       .BackColor = Color.LightBlue
       .Font = New System.Drawing.Font("Times New Roman", 11.0F, System.Drawing.FontStyle.Bold)
       .BorderColor = Color.Black
End With

' If you want to show Chart Legends
chrt.Legends(0).Enabled = True

' If you don't want to show data values and headings as label inside each Pie in chart
chrt.Series(seriesName)("PieLabelStyle") = "Disabled"
chrt.Series("ChartInv").IsValueShownAsLabel = False

' If you want to show datavalues as label inside each Pie in chart
chrt.Series("ChartInv").IsValueShownAsLabel = True

—> See generated Pie Chart Below::

Pie Chart

Pie Chart

Populate/generate multiple charts from dataset

I’m assuming you have defined methods to get data to dataset. Please find code below to fill 4 charts. (Also place 4 charts in your form design and name it as chrt, chrt2, chrt3, chrt4)

Private Sub bgwProcessChart_DoWork(ByVal sender As System.Object, ByVal e As System.ComponentModel.DoWorkEventArgs) Handles bgwProcessChart.DoWork
  Try
     Dim GraphDataSet As DataSet = New DataSet
     ' Loop to fill four charts
              For i As Integer = 1 To 4
                    ' Get data for chart (Your Method!) dont worry about it just there to fill dataset
                    GraphDataSet = _access.generateGraph(cde, i)
                    ' Generate Chart - Here I have passed dataset, chartcontrol  itself, graph number
                    chartGenerate(GraphDataSet, chrt, i)
              Next
        Catch ex As Exception
            MsgBox("No response from server. Please try again." & Chr(10) & "If this error occurs continuously, please reopen the application." & Chr(10) & ex.Message, MsgBoxStyle.Exclamation, "Data Load Failure")
        End Try
End Sub

Read more of this post